We have created several interactive data sections so you can explore the survey data* yourself. Each section allows you to select the filters and views of most interest to you. Choose from:
-
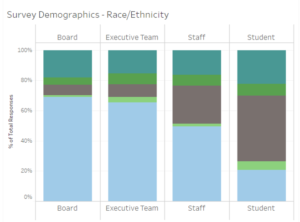 Survey demographics – a profile of the survey respondents by organization type and size plus race and gender representation by level of the organization.
 -
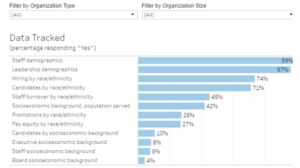 DEI practices – which DEI-related practices are used most frequently by schools, nonprofits, funders, and others.
 -
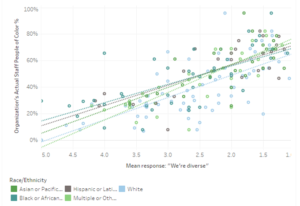 Staff experience highlights – how more than 5,000 staff members in dozens of organizations rate their DEI experiences and beliefs, their intent to stay in the organization, and other factors.
*The data set we use on this site is continually updated with the most recent survey submissions from the field, which grow over time. You may note therefore that figures presented in the Unrealized Impact paper will not match exactly to what you see here.